Recent polls have shown the Liberal Democrats struggling to increase their vote share nationwide, lagging behind their 2019 result. The hope for Lib Dems is that a falling tide drops (sinks?) all boats, with Lib Dem candidates winning where the Tory vote collapses, even without being the direct beneficiaries. Projections using Uniform Swing and Multilevel Regression and Poststratification (MRP) have given some credence to this: Electoral Calculus currently projects the Liberal Democrats to win 17 seats (+6) while a Savanta MRP projected them 21 (+10).
However, MRP may be underestimating the Lib Dems. The reason for this lies in an idiosyncrasy of electoral behaviour. As Chris Curtis discusses here, uniform swing is a surprisingly effective predictor of election results, against intuition. You might assume that voters act ‘proportionally’ – that is, a certain % of voters change party at every election, across constituencies. If, say, 10% of Conservative supporters nationwide switch to Labour, you might roughly expect that percentage to act across most constituencies. So, in a seat where the Conservatives got 80% of the vote, 8% of voters would switch Con->Lab. Where they got 20%, 2% would switch.
This makes intuitive sense. To take it to the extremes, you could argue “surely a party can’t go any higher in the seats where it already has 80-90% of the vote? And it can’t go much lower where it only has 10%?”. Oddly, though, they do. The ‘proportional’ model of voting behaviour doesn’t stand up to the evidence of previous elections. Voters tend to defect in absolute numbers, across constituencies, rather than proportionally. If they moved proportionally, over time you would expect all constituencies to tend towards the mean (i.e. if the Conservatives kept underperforming in their best constituencies and overperforming in their worst, everywhere will be the same eventually). In reality, the opposite has happened.
In the same thread, Chris suggested that this effect might break down between elections.
This is an interesting idea, and might explain some of the squeeze towards the mean that MRPs can suffer from. I tried to test it out by looking at British Election Study data. Below, the results are plotted from some simple models of voting behaviour over time. For each wave, a model is fitted for the probability of defection (from all parties) given that party’s vote share in the respondent’s constituency. Another is fitted with the same model, plus some simple demographic controls.
(1) P(individual defects from party P) ~ party P vote share
(2) P(individual defects from party P) ~ party P vote share + last election vote + (age + education + income + religion + ethnicity):last election vote
The results of these models are plotted below:
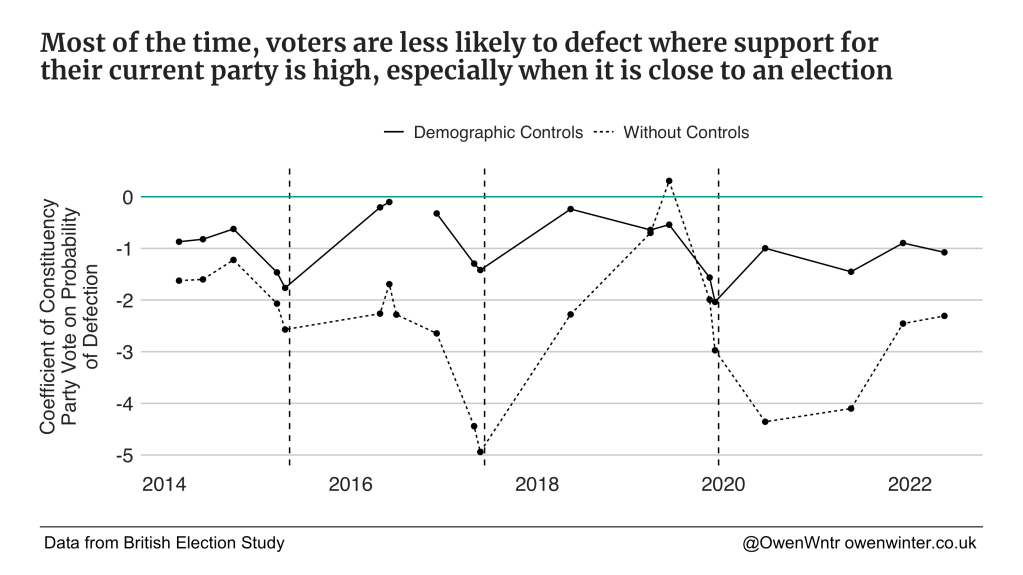
We see a clear pattern. At almost all times, voters are less likely to defect if they live in a constituency where their party has a larger share of the vote. But this effect is more pronounced in the final days before the election (marked here with a dashed line). Once demographics are controlled for, the effect is quite similar for each of 2015, 2017 and 2019 elections. Some possible explanations for this are socialisation, with voters discussing politics with their neighbours near election time and converging, tactical voting and campaigning, and inflated “don’t know” responses mid-term.
So what?
This has significant implications for MRPs, which are used to model constituency-level outcomes. Even if the headline numbers are correct, MRPs need to account for the fact that voters are less likely to defect from their parties in constituencies where the party got a high share of the vote last time. Most good MRPs will do this by including past vote share alongside individuals’ past vote in the model. However, mid-term MRP models will pick up a much smaller effect than at election time. This is fine if you consider the MRP a snapshot of current intention, but not if you want to use them as a prediction of future vote.
The effects of this are unevenly distributed across parties. For example, Labour seems to be performing particularly well in MRP models compared with uniform swing. The Liberal Democrats seem to be doing slightly worse. To test the effect, I have experimented using a recent Redfield and Wilton poll.
I took the same proportions of defectors as reported in the poll crosstabs. These are small samples, so shouldn’t be taken literally, but are useful for this experiment. The poll has 15% of 2019 Conservatives switching to Labour, for example, and 4% to the Liberal Democrats. 91% of 2019 Labour voters stick with the party but 4% switch to the Greens. I apply these proportional switches across all constituencies, to compare with uniform swing. I assume the same weighting of non-voters as Redfield and Wilton, to keep the headline figures matching. I also hold the SNP and Plaid votes the same as 2019, due to sample size (again, this isn’t realistic, but indicative).
This results in 367 seats for Labour, 200 for the Conservatives, and only 3 seats for the Liberal Democrats. Meanwhile, for comparison, a Uniform Swing projection using the same poll would give Labour 347 seats, Conservatives 209 seats, and Liberal Democrats 23. These are very different results, showing some of the problems with assuming proportional changes. For the Liberal Democrats, 40% of 2019 voters are projected to defect. This is around 5% of voters overall, but if you take them proportionally, it leads to a catastrophic drop in support in their current seats. This can’t be made up for by defections from other parties, even with the Conservative collapse, so the Lib Dems lose all but three of their seats.
Now, applying the lessons from BES above, we can re-project the results. I use the average mid-term and election coefficients to rescale the number of defections by constituency. The results with mid-term scaling are 369 Labour, 192 Conservative, 9 Liberal Democrat. With election scaling, they are 362 Labour, 190 Conservative, 19 Liberal Democrat – a big jump in Lib Dem seats.
| Party | Uniform Swing | Proportional Swing | Proportional Swing (rescaled for mid-term behaviour) | Proportional Swing (rescaled for election behaviour) |
| Conservative | 209 | 200 | 192 | 190 |
| Labour | 347 | 367 | 369 | 362 |
| SNP | 47 | 56 | 56 | 55 |
| Liberal Democrat | 23 | 3 | 9 | 19 |
| Plaid Cymru | 3 | 4 | 4 | 4 |
| Green | 1 | 1 | 1 | 1 |
| Other | 1 | 0 | 0 | 0 |
Here we can see how moving from a solely proportional model to a “proportional+”, incorporating differential defections based on previous party support in the constituency, moves the projections back towards uniform swing. Incidentally, these projections show why using uniform swing (or GB-wide polls in general) to model Scotland is futile, as Ballot Box Scotland repeatedly points out.
The issue for MRP here is that any model based on a mid-term survey will show mid-term behaviour. That is, between elections people move away from uniformity, with Labour voters in Labour seats, Conservatives in Conservative seats, etc, only slightly less likely to defect. As the election approaches, we should expect many of these voters to return to their last election vote.
For Labour, this means their vote gets slightly less efficient as the election approaches. Labour already stacks up thousands of wasted votes in safe seats, so increasing vote share there is inefficient. For the Liberal Democrats, the effect is a lifeline, with voters in their key seats returning to the party, making the difference between 9 and 19 seats. While MRP is a very useful way of modelling constituency-level voting patterns, any mid-term MRP will not account for this shift until close to the election.

Leave a comment