
Today, the Boundary Commission for Wales published its revised proposals for the 2023 Parliamentary Review. This includes 32 constituencies to replace the current 40. Here, I use demographic data to project the 2019 election results under the new boundaries.

In 2019, Labour won 22 MPs, the Conservatives 14 and Plaid Cymru 4. The new boundaries (below) cut across many of these constituencies.
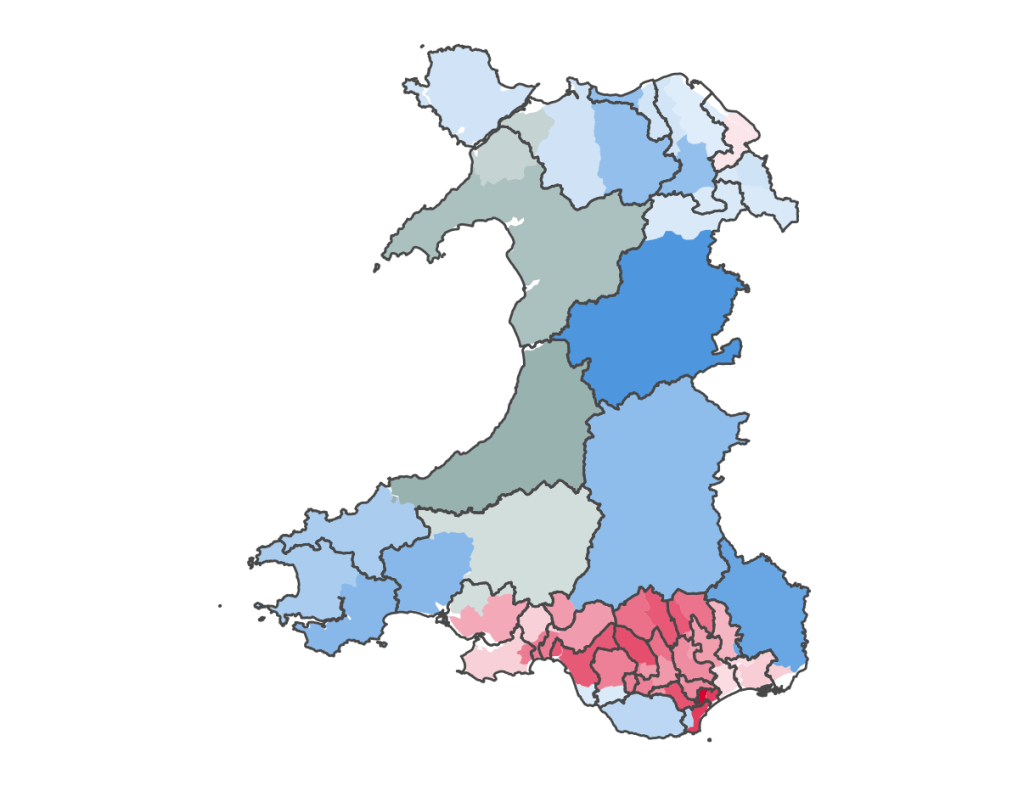
To model the results under new boundaries, I match census output areas to the new constituencies. This makes it possible to find aggregate demographic data for new constituencies. I then fit simple demographic regression models* for 2019 election results using the old constituencies, then apply this model to the intersections of old and new constituencies. Finally, I scale the predicted results by the true 2019 results for old constituencies and combine the results for each new constituency.
This method likely has substantial prediction error, with a small sample size of just 40 constituencies in 2019. However, it uses demographic data to improve the predictions for new constituencies over a weighted average. The final results being scaled by true 2019 results also reduces error. It is also worth noting that these results do not account for local campaigning, they are only a reflection of the 2019 results as they were.
This results in the following projected 2019 results under new boundaries:
Labour – 19 (-3 vs now)
Conservative – 11 (-3)
Plaid Cymru – 2 (-2)
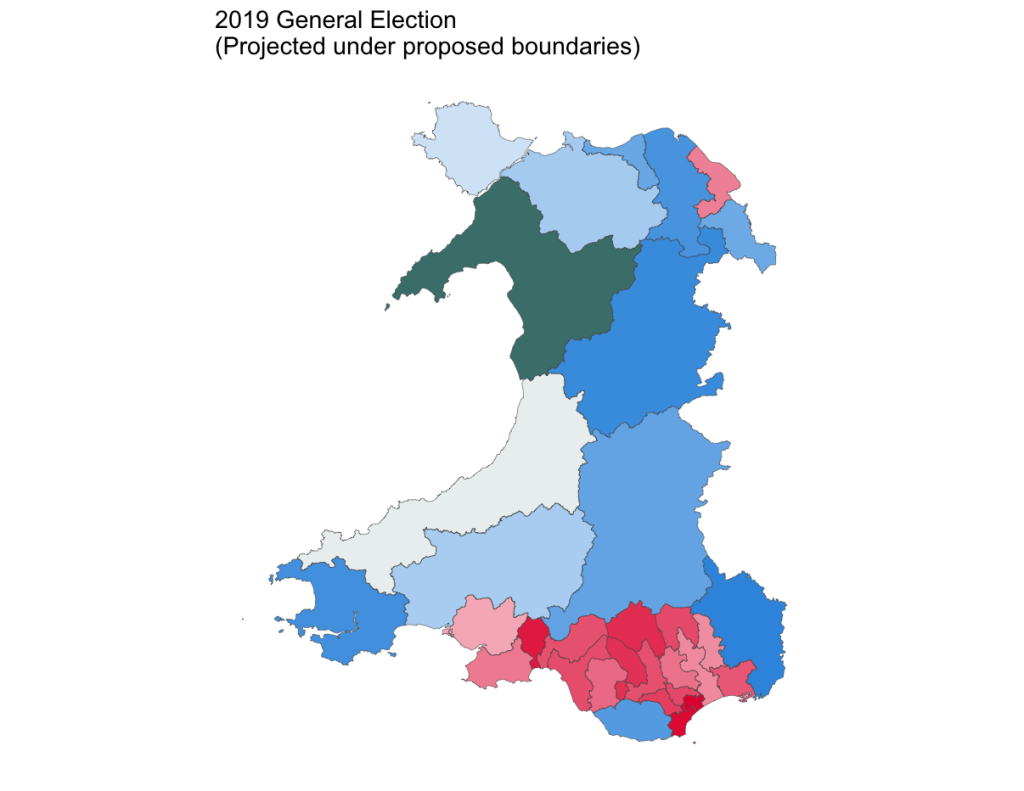
Here, we can see how Plaid Cymru pay the price of two constituencies combined with neighbouring Conservative areas. Meanwhile, Labour and the Conservatives both lose three constituencies.
However, polling has moved massively since the 2019 Election. The most recent poll of Welsh voting intention was in late September. This was immediately before the mini-budget and subsequent Tory collapse, so likely represents a much smaller Labour lead than would currently be found.
By applying a uniform swing using this poll, under the new boundaries, Labour gains 7 MPs, Plaid Cymru gain 1 and the Conservatives lose 8.
Labour – 26 (+7 versus 2019 results under new boundaries)
Conservative – 3 (-8)
Plaid Cymru – 3 (+1)

* Quasi-binomial regression with each party’s vote as a percentage of the total population (rather than votes) as the dependent variable. This means party votes and turnout are modelled together. Each model has between 2 and 5 variables, including % age 18-49, % Welsh speaking, % identifying as British only, % working in agriculture, % born in Wales, average level of household deprivation, % with no qualifications or level one qualifications and % with level 4 or higher qualifications.

Leave a comment