As May 21st’s ‘Super Thursday’ elections come into view, all eyes are on whether Nicola Sturgeon will secure her majority for independence, and whether Labour will cling on in Hartlepool. But Super Tuesday also features 8 of England’s biggest electoral tests, in the form of combined authority mayoral elections.
These elections will give individual politicians huge electoral mandates, an unusual occurrence in British politics, so politicos are characteristically pouring over the ‘electability’ and personal qualities of the candidates. But do candidates really make a difference?
In most metro mayor elections so far, the evidence suggests not much. In 4 of the last 13 elections (5 in London, 8 combined authorities), both Labour and the Conservatives have been within 5% of what you’d expect based on the region’s last general election vote. In four more, both have been within 10%. The average deviation of the three main parties from the region’s ‘partisanship’ is just 6.4% – despite this number being dragged up Labour’s 38% collapse in 2000.
| Labour | Conservative | Lib Dem |
| Burnham 2017 (+22%) | Johnson 2012 (+17%) | Cantrill 2017 (+9%) |
| Dobson 2000 (-38%) | Bowles 2017 (-19%) | Paddick 2008 (-9%) |
So what should our expectations be for the upcoming elections?
With no consideration of incumbency at all, the metro mayor map looks very favourable to Labour. Although the party lost four out of the six mayors up for election in 2017, this was in the context of an abysmal national picture, with the party languishing 17% behind the Conservatives. Since then, Labour has pushed the Conservative lead down to 7% and Labour-voting West Yorkshire and London have been added to the 2021 map.
By combining 2019 election results with current polling and some random variation, the expectation would be that Labour hold Liverpool (94% probability), London (88%) and Greater Manchester (86%) pretty comfortably, add West Yorkshire (79%), and gain the West Midlands (70%), Tees Valley (66%) and West of England (66%) narrowly from the Conservatives.
To be clear: this isn’t a forecast. It is a ‘prior expectation’ based only on each region’s partisanship and current polling. But it is useful to compare parties’ performances against.
| Region | Lab | Con | Lib | Other |
| Liverpool | 94% | 0% | 0% | 5% |
| London | 88% | 9% | 0% | 3% |
| Greater Manchester | 86% | 11% | 0% | 3% |
| West Yorkshire | 79% | 17% | 0% | 4% |
| West Midlands | 70% | 24% | 0% | 6% |
| Tees Valley | 66% | 34% | 0% | 0% |
| West of England | 66% | 25% | 0% | 9% |
| Cambridgeshire and Peterborough | 26% | 72% | 2% | 0% |
It is also useful because it can allow us to see what sort of effect an incumbency bonus might have. This is probably one of the most unpredictable elements of the elections, with only three past mayoral elections featuring an incumbent (2012, 2008 and 2004) and all of them in London. This is far too few to make assumptions about other cities, but of these the incumbents (Johnson in 2012 and Livingston in 2008 and 2004) they over-performed the model by +17.4%, +2.6% and -1.1% respectively. This is an average of +6.3%, incidentally the same margin by which Sadiq Khan is currently over-performing in polls.
In the other metro mayor elections, the incumbency effect is likely to be smaller. The mayoral positions are less established, probably have lower name recognition, and are covered by less regional media. We can still safely assume that the figure is higher than 1.75%, the predicted incumbency effect for MPs in general elections (Middleton, 2018).
Between 1.75% and 6.3%, the range of win probabilities for Labour varies a lot:
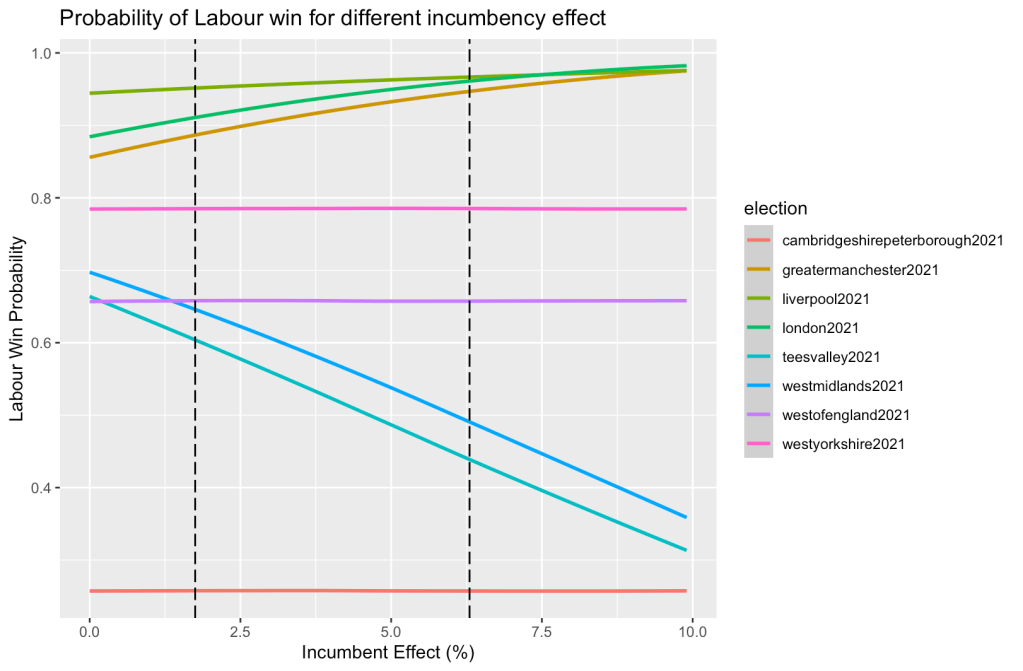
When the incumbency effect is high (6.3%), Labour goes from being favourites to (narrow) underdogs in the West Midlands (49%) and Tees Valley (44%), whilst all but sealing the deal in Greater Manchester (95%) , London (96%) and Liverpool (97%).
Whether the incumbency effect is big or not, Labour should hope to gain. If it doesn’t, it could signal some serious issues. None of Labour’s incumbent mayors are at any risk, and West Yorkshire should be a relatively simple win. Labour probably have a slight edge in the West of England, which has swung away from the Conservatives since 2017, and are highly competitive in both Tees Valley and the West Midlands.
What about the supplementary vote?
One other question going into the metro mayor elections, which adds a layer of uncertainty, is the effect of the supplementary vote electoral system. While the system might have a significant ‘psychological’ effect, changing the way parties campaign and voters vote, I don’t think it will have a significant ‘mechanical’ effect.
In the 13 metro mayor elections, the first round winner has won the second round every time. In 81 Police and Crime Commissioner elections, which also use SV, the first round winner has won the second round in all but 6 elections. The effect of SV doesn’t seem to benefit or disadvantage any one party that significantly, either, with both Labour and the Conservatives losing out in PCC elections.
In the 13 metro mayor elections, Labour won about 55% of third party voters in the second round, compared with 46% for the Conservatives. This sounds like a big difference but first round winners typically only need around 39% to win, so in practice it makes little difference (only one Conservative candidate received less than 39% of second preferences, in Sheffield City Region in 2018). It is also partly explained by Labour generally having bigger first round leads than the Conservatives, which does appear to have an impact on second round performance.
Comparing the model with and without a second round bonus for Labour shows how few scenarios there are where this makes a difference:
| Region | Labour Win Probability (2nd round advantage) | Labour Win Probability (no 2nd round advantage) |
| Liverpool | 96% | 96% |
| London | 94% | 90% |
| Greater Manchester | 92% | 90% |
| West Yorkshire | 79% | 77% |
| West of England | 66% | 64% |
| West Midlands | 57% | 56% |
| Tees Valley | 52% | 52% |
| Cambridgeshire and Peterborough | 26% | 25% |
Here, the effect is bigger in places where the Liberal Democrats and other parties might get a higher share of the vote (a 4% increase in London, for example), but still very small. With the advantage, Labour wins on average 5.6 out of 8 mayoralties, without it they win 5.5.
So, who is going to win?
As I said above, none of these figures are a forecast. 13 elections is far too small a sample size to make judgements about many of the variables that affect election results. That said, it does seem likely that most metro mayor elections reflect their region’s partisan lean pretty closely. In terms of incumbency effect, my personal guess would be that it’s worth around 4%, but that’s only worth as much as any guess. Given that, Labour is probably on track for four easy wins and four competitive races, if national polling stays where it is.
If I had written a book, I might offer to eat it if Labour loses Liverpool. But other than that we’ll have to wait and see.
Data and code here.

Leave a comment