The 2020 election had a huge focus on state polls – far more so than in 2016, when more national polls were commissioned and discussed. This makes sense given the distorting effect of the electoral college. The renewed focus was supposed to ensure another upset would not happen again, with higher quality polls in swing states; journalists running fewer stories solely about national polling; and more polls conducted in the upper midwest, which unexpectedly swung to Trump in 2016. Despite this focus, state polls in 2020 performed even worse than 2016, by some measures.
One particularly striking thing about the 2020 election results was the very low variation in swing from Biden and Trump. Aside from a couple of notable exceptions (looking at you, Florida), states moved far more uniformly than state polls predicted. For example, none of the ‘long-shot’ Trump states – Ohio, Iowa, South Carolina, Alaska, Montana, Kansas, Missouri, Utah – swung as heavily towards Biden as polls suggested they might. Meanwhile the supposed gap between Wisconsin and Michigan – where Biden polled very well – and Pennsylvania where he lagged slightly, did not materialise. The majority of states moved between 1% and 5% towards Democrats vs 2016, with the lowest standard deviation of state-level changes since at least 1976 (and probably much longer).
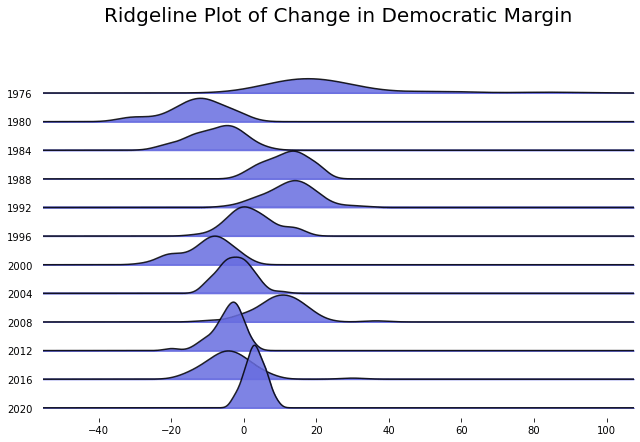
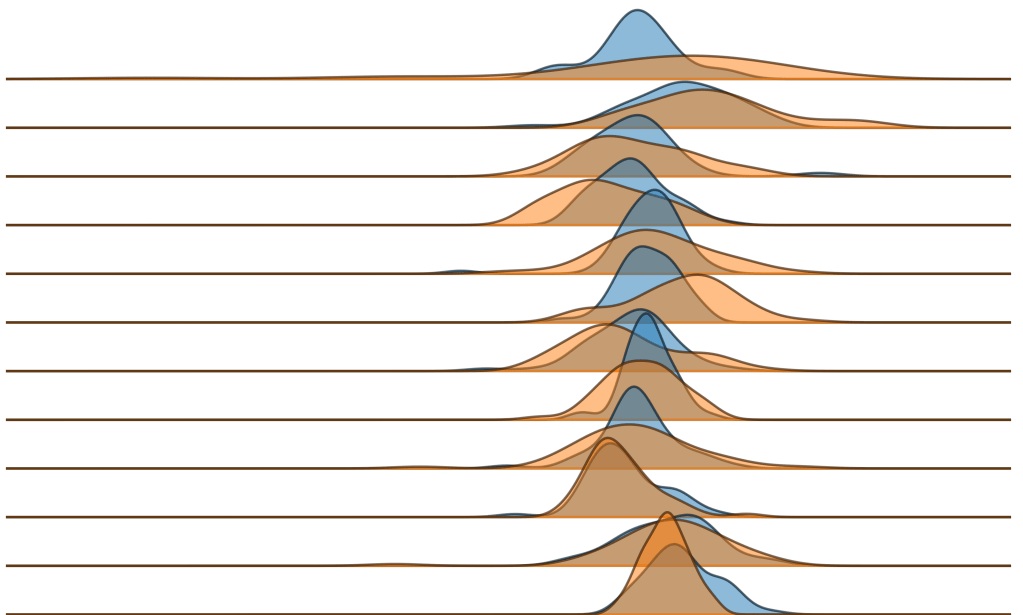
This Ridgeplot shows the striking consistency of 2020 election swings, having clearly the lowest standard deviation of the density plots. Another pattern is the difference between election years and re-election years. Both 2012 and 2004 have much lower state-level deviation than their preceding cycles. In a more polarised environment, re-election years are far more focussed around opinions on the President, which are best predicted by voting patterns of four years before. If either Biden or Trump runs again in 2024, we should expect little variation in state-level swings.
Given the pattern of falling state-level deviation in recent cycles, it may be the end of huge state swings. In 1976, for example, Georgia swung from a 50% margin for Nixon to a 34% margin for Carter. The Democratic margin increased by 84% in Georgia, while it increased by 25% nationwide. This swing is so huge that it makes the x-axis of my ridge plot look a bit silly, and it is practically unthinkable in 2020.
The confluence of lower deviation in swing and lower accuracy in state polls means that in 2020 uniform swing outperformed state polls in swing states for the first time. By uniform swing, I mean taking the change in Democratic margin nationwide predicted by polls since the last election and applying it uniformly to every state. In election years with significant localised dynamics, this approach fails abysmally. In Georgia in 1976, for example, a uniform swing would have predicted a Carter loss by 26%. But in re-election years, and especially in heavily Republican or Democratic states, uniform swing performs surprisingly well.
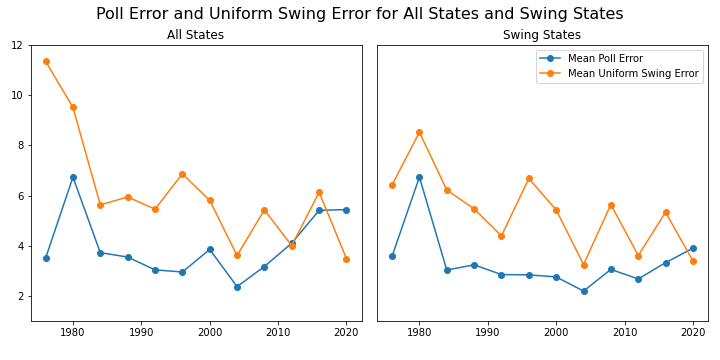
As we can see in the plots above, the average error of uniform swing follows the same pattern as standard deviation – lower in recent cycles and reelection years. State polls are usually stronger in swing states while uniform swing is usually fairly consistent across all states.

Of course uniform swing should not replace state polling – this is the first time uniform swing has outperformed state polls in the history of US presidential polling and it seems unlikely to happen again in 2024 – but perhaps uniform swing should be used to anchor our expectations, especially outside of the swing states. In 2020, polls in a large numbers of deep-red states were suggesting huge swings towards Biden – far larger than national polls implied. Weighting our expectations slightly more towards the national picture might have made us more sceptical of presidential and senate polls in states Trump won by huge margins in 2016.
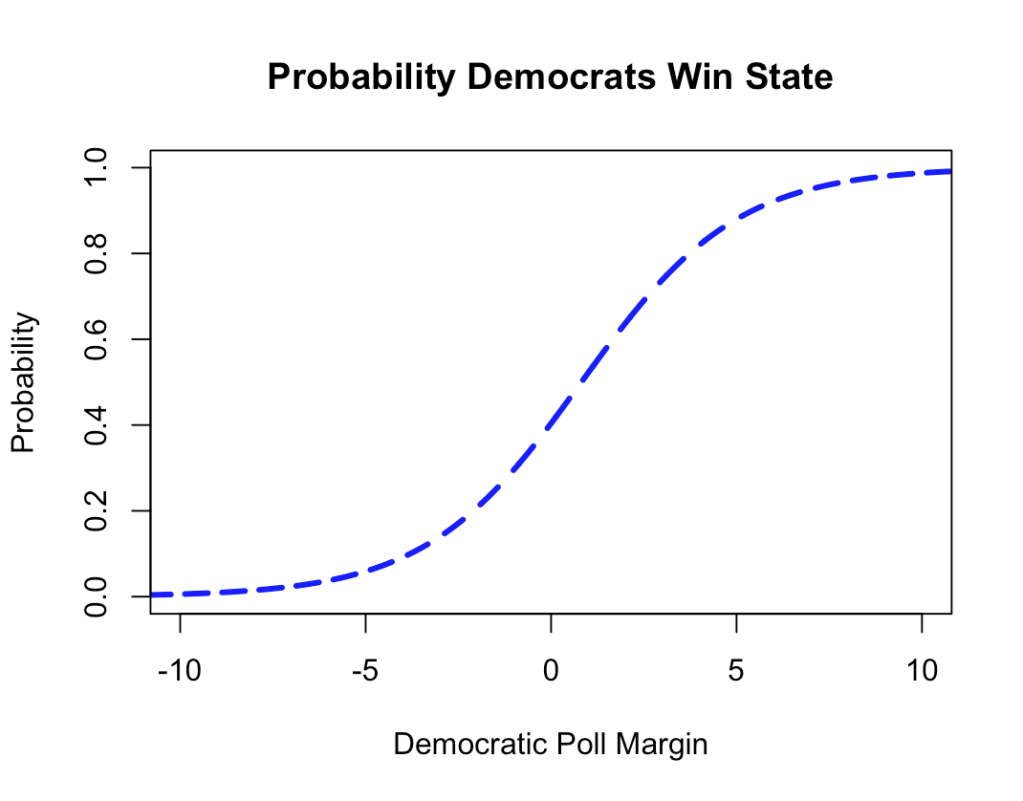
Meanwhile, while state polls have now had above average error for three elections in a row, they are still an important tool for predicting election results. The most important thing is to interpret them as fuzzy/imprecise indicators. As a general rule, we can say any state polling with a lead under 7% has a significant (but still small) chance for an upset, while any state polling with less than a 5% lead should be considered competitive. In 2020, this would have given us a pretty clear indication of where the election was headed, but with a bit less shock when North Carolina (polling lead 1.7%) and Florida (polling lead 2.5%) failed to materialise for Biden.

Leave a comment